
 PDF
PDF
Introduction
Examination of inks on questioned documents has become common, and law enforcement agencies using this technique during their criminal investigations. Questioned documents can include diary entries, or whole diary, reconstructed files and false dated correspondence, prepared to show a particular sequence of events, occurred in the past or more simply a forged signature or an altered cheque [1,2]. Subtle alteration to documents, such as papers involving medical malpractice, tax returns, will scripts and insurance claims, divorce judgments, copyright certificates, agreements related to labour management disputes; employee problem settlements and a variety of contracts etc. can have significance financial implications. These kinds of many cases have been submitted by a number of crime reporters or document investigators. Incidents of forgery have increased tremendously and to alter these documents printers, copiers (inkjet printer) are widely used. The detection of alterations or additions to a document and an assessment of when the document was written have become a prime concern of document examiners and ink chemists [3,4]. Document examiners have invented methods which have been successfully used for examining and identifying printing inks scientifically. These techniques include paper chromatography, paper electrophoresis, luminescence, micro spectrometry, diffuse reflectance Fourier transform infrared, luminescence photography, laser excitation and spectroscopy, thin-layer chromatography, high-performance liquid chromatography, and capillary electrophoresis [1-10]. There is little or no information regarding the application of a sequence of selected standard techniques to the Nigerian population of inks used in printing. Also, no report presenting result of characterization/ comparison of inkjet printer inks collected from the market in Nigeria. There is a need to make effort in filling the gap in current analytical methodology of forensic questioned document examination in the country. Characterization of writing/printing instruments used to produce the document such as ink, paper etc. may be a leading step in the investigation of forgery in Nigeria. The aim of this study therefore is to analyze, compare and contrast ink extracted from printed documents using two brands of printing cartridge in the Nigerian market. This will be achieved by subjecting the extracted inks to Fourier Transform Infrared Spectroscopy (FTIR) analysis. It is hoped that the results from this study will provide valuable information / data if an admitted sample is provided for comparison with the suspect printed document in Nigeria. Also, the proposed method in the study could be used for examination of ink on documents taking extremely small (negligible portion) of the sample from an unimportant area of the document with the permission of the court.
Materials and Method
Materials
All reagents used were analytical grade reagents obtained Sigma Aldrich Company U.S.A. Double distilled water was used throughout for the preparation of samples and dilution of the stock standard solutions. The glass wares used in the study were decontaminated by overnight soaking in 5 % HNO3.
Sample collection
The method used in sample collection is that of Sharma et al. [11]. Five colored printouts each containing of cyan, magenta, yellow and black color were printed from inkjet printers of two leading ink printing manufacturers (Silver tosh and Hewlett Packard) in Nigerian Market. White paper of A4 size was used to take all samples. All four printed color i.e. cyan, magenta, yellow, and black from each printout were extracted, analyzed and interpreted. The two leading manufacturers were marked as A and B respectively and their different models were marked as 1, 2, 3and so on. The samples were given marking as A1, A2, A3 ,A4,A5,….A10 for different models of brand A and B1, B2,B3,B4…; for different models of brand B.
Separation of ink from printed Document
The ink from the printed document was separated following the method of Sharma et al. [11]. A colored squared block of constant area was taken from the sample document and cut into small pieces. The pieces of paper were then transferred to 15 ml beaker and titurated with 5 ml of methanol. The sample was then allowed to be extracted at room temperature with intermittent shaking. The methanol extract was then transferred to 10 ml volumetric flasks after filtering through a filter paper. The extract was made up to 4 ml. The same procedure was followed for all samples for cyan, magenta, yellow and black. In order to avoid any interference and to record the response of matrix i.e. paper and the reagent i.e. methanol towards IR, the blank samples of matrix and reagent were also prepared following the same procedure.
Preparing Pellet for Scanning
2ml of methanolic solution was taken in a china dish and evaporated at room temperature to dryness and heated for about 10minutes in an oven. The residue was scratched from the walls of china dish and mixed intimately with dry KBr. After this process pellets were prepared by using a pellet maker. The same procedure was followed for all samples of Cyan, Magenta, Yellow and Black Color.
Scanning of Samples
The FTIR analyses of the samples were carried using a spectrometer from Agilent technology. The scanning was done through a wave range of 3500 to 400 wave number cm-1
Results and Discussions
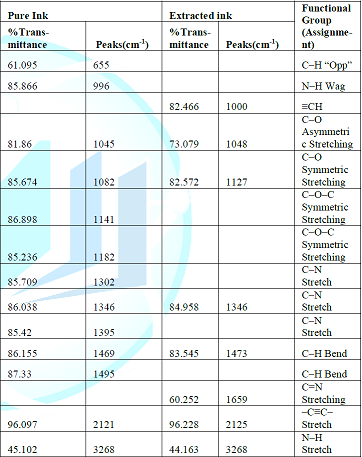
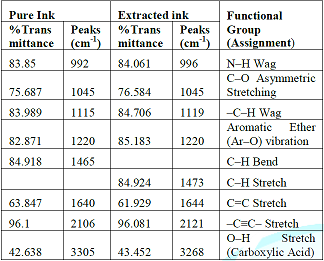
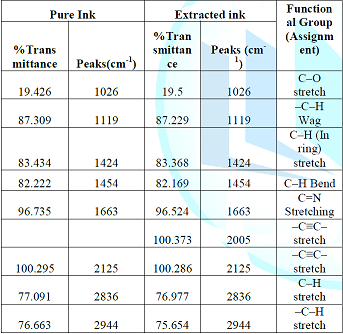
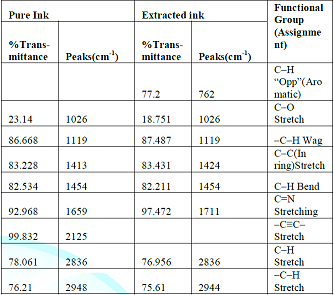
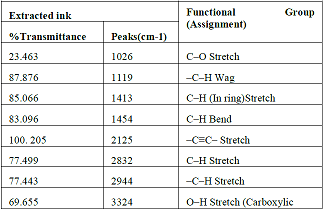
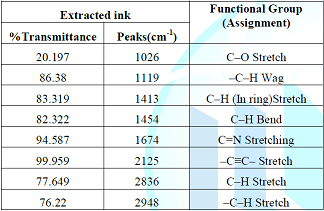
FTIR study Figures 1-5 shows the FTIR spectra of pure and extracted inks of Brand A while the spectra obtained for Brand B are presented in Figures 6,7. Peaks obtained from the various spectra as well as assignments to the respective peaks are presented in Tables 1-5. The results presented show the various % transmittances corresponding to the respective wave length of absorption. It should be noticed that most of the absorption bands in the inks spectra are complex peaks, and exhibited band in different areas that are common to many organic compounds typically used in ink formulation. For instance Peaks in the range from 2000 to 1700 cm_1 were observed, which is the characteristic frequency of carbonyl (C=O) stretching vibration indicating that aliphatic acids or their esters are present in the ink colors studied [12].
There are
indications of the presence of triarylmethane dyes, epoxy resin, alkyd
resin, and solvents in the inks as there were peaks assigned to the vibration
of aromatic ether (Ar – O), asymmetrical and symmetrical stretch vibration of
aliphatic ether (C – O), asymmetrical and symmetrical stretch vibration of the
C – O –C bonds.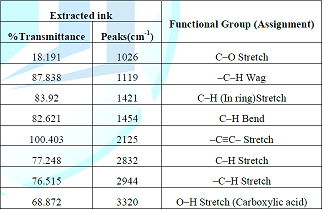
The FTIR
spectra obtained were also found to show highly characteristic absorption bands
depending upon the compositions of the printer inks as it could be seen that
every printer ink batch exhibits characteristic IR spectra. 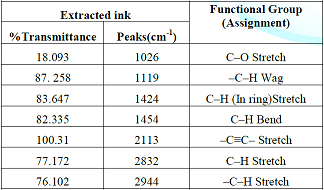
Different brands of ink
cartridge also exhibited different characteristic IR spectra. Also, some common
ingredients in different brands gave similar FTIR spectral bands for those
components. It was also found that pure ink and its extract from the same brand
exhibited similar FTIR spectra. 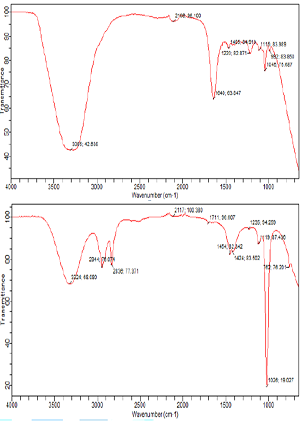
Figure 1: FTIR spectra of (A) pure (B) extracted magenta ink of Brand A.
For instance,
similar peaks for O‒H Stretch, C‒O asymmetric were stretching for the same
brand. However, ink extracts from different cartridges of different brands on
the same paper exhibit marked differences. The difference between various
samples of ink can be seen by observing at the intensity of main peak, the
pattern of each spectrum and the absence or presence of some characteristic
bands.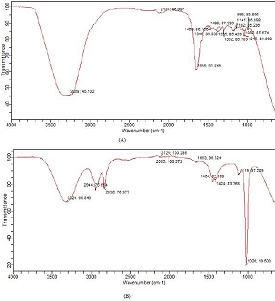
Figure 2: FTIR spectra of (A) pure and (B) extracted cyan of Brand A.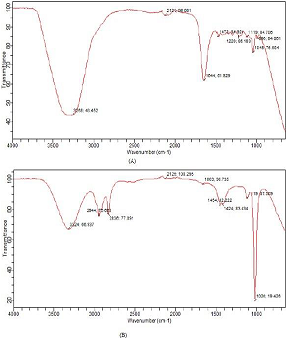
Figure 3: FTIR spectra of (A) pure and (B) extracted yellow ink of Brand A.
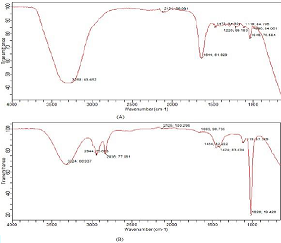
Figure 4: FTIR spectra of (A) pure and (B) extracted black ink of
Brand A.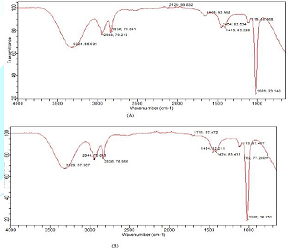
Figure 5: FTIR spectra of (A) methanol (B) methanol and paper
extract.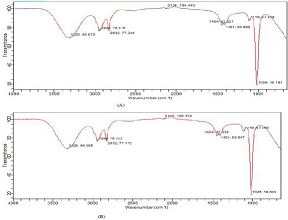
Figure 6: FTIR spectra of extracted (A) black ink of brand B and (B)
magenta of Brand B.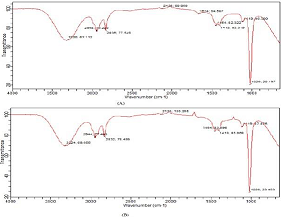
Figure 7: FTIR spectra of extracted (A) yellow ink of brand B and (B) cyan of Brand B.
For instance C‒H Opp (Aromatic) peak which was observed at 762 in the yellow ink extracted of brand A was absent in brand B, the ‒ C≡C‒ stretch peak at 2125 present in the black ink extract of brand A was absent in brand B, the N‒H Wag at 996 in the extracted cyan ink sample of brand A was absent in brand B Cyan ink sample, the ≡CH peak at 1000 in the magenta ink sample extract of brand A was absent in brand B.
According to Beer-Lambert law, absorption is related to concentration (C in mole), path length (d in cm) and molar absorptivity according to the following equation [13],
If the incident radiation entering the sample cell is given by I0 and the amount transmitted is It. The transmittance of the solution is defined as the fraction of the incident radiation that is transmitted and can be written as,
On the other hand, percentage transmittance is given in equation 3 while equation 4 gives
From the logarithm of equation 4, equation 5 is obtained,
The left hand side of equation 5 corresponds to absorbance (Ia). Therefore, the relationship between absorbance and transmittance is given according to equation 6,
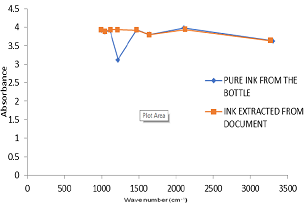
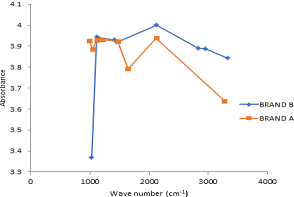
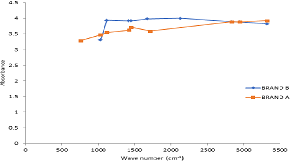
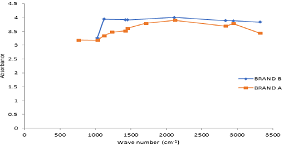
Using
equation 6, values of absorbance were calculated and plotted with their
corresponding wave numbers. These are presented in Figures 8-15. In Figures
8-11, plots showing the variation of absorbance with wave number of FTIR absorption by pure and
extracted inks of Brand A are presented. Figures 12-15, show plots of the
variation of absorbance with wave number of FTIR absorption by inks extracted
from documents printed using the different studied brands (Brand A and B). From
the plot, it can be seen that two brands exhibited marked differences in their
absorbance.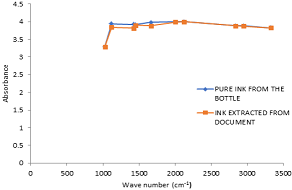
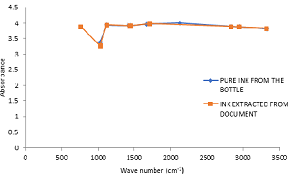
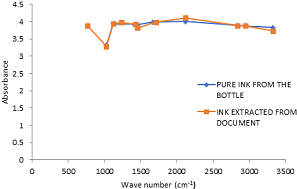
Figure 11: Variation of absorbance with wave number of FTIR
absorption by pure and extracted yellow ink of Brand A.
From the
plot, it can be seen that both pure and extracted inks of the same brand
exhibited maximum absorption at the same wave number and also show similarity
or closeness to similarity in each other wave number. This
shows that the extracted ink has some compatibility factors with the pure ink
of brand A.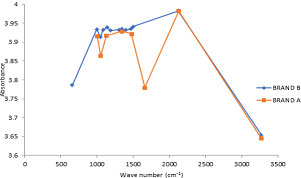
Conclusion
Based on the obtained results the following conclusion can be drawn. Fourier Transform Infrared Spectroscopy, though strictly not nondestructive could be used for examination of inks on documents taking extremely small (negligible portion) of the sample from an unimportant area of the document with the permission of the court. Fourier Transform Infrared Spectroscopy is a simple, direct and reproducible method of comparing computer printing inks. Inks when extracted from printed documents will exhibit similar absorption spectra while those from different brands will give marked differences in their absorption bands.
References
1. Tebbett I. Forensic science application (1991) Forensic Science Review 3: 71-82.
2. Harris J. A Preliminary report on the nondestructive examination on question documents by FTIR spectroscopy (1991) Canadian Society Forensic Sci J 24: 5-8.
3. Egan JM, Hagan KA and Brewer JD. Forensic analysis of black ballpoint pen inks using capillary electrophoresis (2005) Forensic Science Communications 7: 21.
4. Egan WS, Galipo RC, Kochanowski BK, Morgan SL, Bartick EG, et al. Forensic discrimination of photocopy and printer toners III. Multivariate statistics applied to scanning electron microscopy and pyrolysis gas chromatography/mass spectrometry (2003) Analytical Chemistry 376: 1286-1297. https://doi.org/10.1007/s00216-003-2099-3
5. El-Din NMS, Sabaa MW and Hamed HR. Influence of Three Chemical Erasures on Different Types of Inks Marked on Several Document Papers: An Analysis of the Chemical Reactions Occurring on Paper Between Different Liquid Erasures and Writing Inks (1998) Int J Forensic Document Examiners 4: 9.
6. Fabianska E and Trcinska BM. Differentiation of ballpoint and liquid ink. A comparison of method in use, problem of forensic science (2001) 46: 383-400.
7. Fanali S and Schudel M. Some separations of black and red water-soluble fiber-tip pen inks by capillary zone electrophoresis and thin layer chromatography (1991) J forensic science36: 1992-1997. http://dx.doi.org/10.1520/JFS13135J
8.Geiman I, Marco-Leona BS and John LR. Application of Raman Spectroscopy and Surface Enhanced Roman Scattering to the analysis of synthetic dyes found in ball point pen inks (2009) J forensic science
54: 947-952.https://doi.org/10.1111/j.1556-4029.2009.01058.x
9. Hofer R. Dating of ballpoint pen inks (2004) J forensic science49: 1-5. https://doi.org/10.1016/j.microc.2017.05.014
10. Horton R and Nelson L. An evaluation of the use of laser-inducer infra-red luminescence to differentiate writing inks (1991) J Forensic Science 36: 838-843. https://doi.org/10.1520/JFS13093J
11. Sharma R, Gyal K, Chettree A, Baggi TR and Gupta AK. Comparative analysis of inkjet printer inks extracted from printed documents by FTIR spectrophotometry (2013) IOSR J Applied Chemistry5: 36-41. http://dx.doi.org/10.9790/5736-0533641
12. Ameh PO. A comparative study of the inhibitory effect of gum exudates from khaya senegalensis and albizia ferruginea on the corrosion of mild medium (2015) Int J metals1-3. http://dx.doi.org/10.1155/2015/824873
13. Eddy NO, Ameh PO and Ibrahim A. Physicochemical characterization and corrosion inhibition potential of ficum benjamina (FB) gum for aluminum in 0.1 M HCL (2015) Walailak J sci and technol 12: 1121-1136. http://dx.doi.org/10.14456/wjst.2015.94
*Corresponding author:
Paul Ocheje Ameh, Department of Chemistry and Forensic Sciences, Nigeria Police Academy, Wudil, Kano, Nigeria Email: nocaseoche@yahoo.com
Citation:
Ameh PO and Ozovehe MS. Forensic Examination of Inks Extracted from Printed Documents Using Fourier Transform Infrared Spectroscopy (2018) Edelweiss Appli Sci Tech 1: 10-17
Keywords
Forensic science, ink analysis, Document examination, FTIR
